🌥️Cloud Study🌥️/NHN
[ NHN Cloud ] 3-Tier Architecture 수동 프로비저닝-3 (Grafana, Prometheus 설정)
L_Chae
2024. 8. 6. 17:03
1. Node Exporter 설치 (Ubuntu 22.04 LTS 예시)
  wget https://github.com/prometheus/node_exporter/releases/download/v1.2.2/node_exporter-1.2.2.linux-amd64.tar.gz
  tar xvfz node_exporter-1.2.2.linux-amd64.tar.gz
  cd node_exporter-1.2.2.linux-amd64
2. 서비스 시작 및 자동 시작 설정
  ./node_exporter
public 인스턴스에는 Grafana를, worker로 작동하는 private 인스턴스에는 Grafana와 node-exporter를 설치해주었다.
Grafana, Prometheus 자동 시작
인스턴스를 내렸다 다시 올린 경우, Grafana와 Prometheus를 다시 실행해주자 (나중에 이것도 자동으로 되도록 변경) -> 변경완료
# 수동으로 재시작 ---------------------------------------------------------
# Grafana
sudo systemctl start grafana-server
sudo systemctl enable grafana-server

# Prometheus
sudo systemctl start prometheus
sudo systemctl enable prometheus

# 서비스 파일 설정 후 활성화 ---------------------------------------------------------
# systemd 서비스파일 설정 : Prometheus
sudo nano /etc/systemd/system/prometheus.service

[Unit]
Description=Prometheus
Wants=network-online.target
After=network-online.target

[Service]
User=prometheus
Group=prometheus
Type=simple
ExecStart=/usr/bin/prometheus --config.file=/etc/prometheus/prometheus.yml
Restart=always

[Install]
WantedBy=multi-user.target

# systemd 서비스파일 설정 : Grafana
sudo nano /etc/systemd/system/grafana-server.service

[Unit]
Description=Grafana instance
Documentation=http://docs.grafana.org
Wants=network-online.target
After=network-online.target

[Service]
EnvironmentFile=/etc/default/grafana-server
User=grafana
Group=grafana
Type=simple
ExecStart=/usr/sbin/grafana-server --config=${CONF_FILE} --pidfile=${PID_FILE_DIR}/grafana-server.pid --packaging=deb --quiet
Restart=always
WorkingDirectory=/usr/share/grafana

[Install]
WantedBy=multi-user.target

# 서비스 파일 재로드
sudo systemctl daemon-reload

sudo systemctl enable prometheus
sudo systemctl enable grafana-server

sudo systemctl start prometheus
sudo systemctl start grafana-server

# 서비스 상태 확인
sudo systemctl status prometheus
sudo systemctl status grafana-server
Grafana와 Prometheus 연동

Prometheus 선택
Grafana Home에서 좌측 하단에 위치한 Connections -> Data sources를 선택한다.
Connection을 추가해주는데, 나는 private의 IP주소를 입력해주었다.
하단의 Save & test를 클릭해서 Successfully ~가 출력되면 성공이다.
web server로 작동하는 private 인스턴스 2개에 모두 prometheus를 설치했으므로 두 인스턴스에 대한 모니터링을 진행하기 위해 하나 더 설치해주자.
Grafana dashboards | Grafana Labs
No results found. Please clear one or more filters.
grafana.com
Dashboards - New Dashboard 에서 대시보드를 직접 만들거나, 위의 Grafana의 대시보드 페이지에서 맘에 드는 템플릿을 가져올 수 도 있다.
Grafana와 Mail Alert
mail 뿐만 아니라 slack 등 다른 채팅 채널에서도 가능하다.
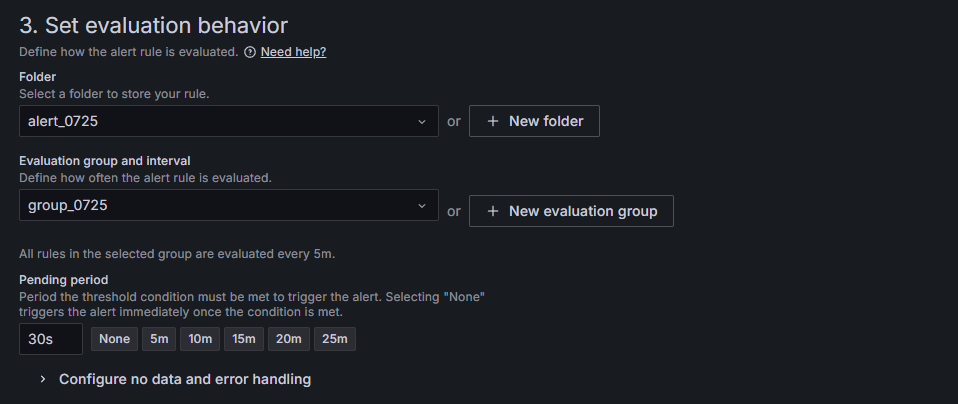
메모리 사용량에 따라 알람을 보내도록 하는 실습을 진행해보자.

Alerting - Alert rules에서 New alert rule를 클릭해주자.